Trailing Stoploss Reversal Level
This lesson will cover the following
- Explanation and calculation
- How to interpret this indicator
- Trading signals, generated by the indicator
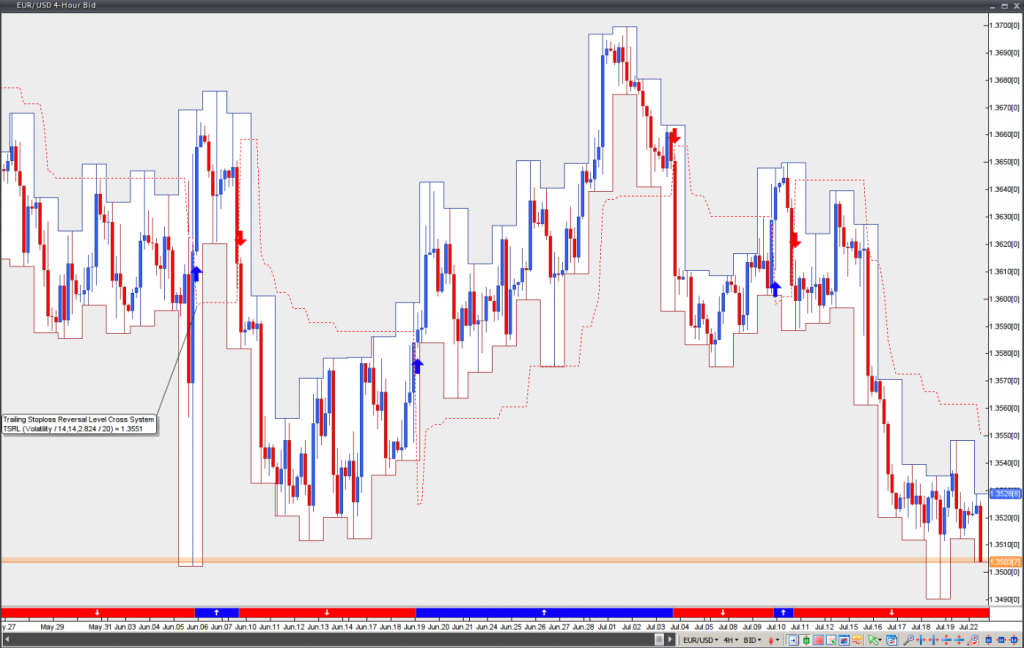
This indicator follows below or above prices in dependence on its position in relation to the price. A trader may set this indicator to follow prices, based on volatility or based on a predefined amount of pips.
Trailing stoploss levels have recently become a popular method to make exits from trades without any involvement of emotions. Therefore, this indicator is helpful when it comes to controlling risk.
When a long trade is active, the trailing stoploss level indicator follows below prices and ratchets itself higher, as prices surge. When a short trade is active, the trailing stoploss level indicator follows above prices and ratchets itself lower, as prices decline.
In case the price returns to the trailing stoploss level, the latter will remain at its prior level and will never distance from the price. This way potential gains will be preserved, while losses will be restrained.
A long position should be closed, when the price moves back below the trailing stoploss level. A short position should be closed, when the price moves back above the trailing stoploss level.
