Fast Moving Average Crossovers
You will learn about the following concepts
- Fast moving average crossovers
- Using them to your advantage
We have spoken much about moving averages throughout our trading guides, particularly in the articles “Introduction to Moving Averages“, “Simple Moving Average” and “Exponentially Smoothed Moving Average“, so now we will turn our attention toward moving average crossover strategies. You can have crossovers between fast moving averages, between slow moving averages or a mix between the two types. Here we will discuss fast moving average crossovers.
For this strategy we will use a 15-minute time frame and three exponential moving averages – a 10-, a 25- and a 50-period one. The entry and exit rules are simple. Once the 10-period EMA penetrates the 25-period EMA, continues and crosses through the 50-period one, enter in the 10-period EMAs direction. However, before executing the trade you need to wait for confirmation, which comes after a bar closes on the other side of the 50-day EMA.
You hold on to your position until one of the following two scenarios occur: the 10-period EMA crosses back either the 25-period EMA, or its retracement extends further to the 50-period EMA. The latter exit strategy carries the chance of better results because the price might reverse and head back in the desired direction before crossing the 50-day EMA. However, if it doesnt, your profit would be smaller in comparison to a 25-period EMA exit. In both cases, an exit out of the position should be done after a confirmation, i.e. after a bar closes beyond the 25 or 50-period EMA.
Trend required
Moving average crossovers are a reliable trading strategy, but only in trending markets. They have none-to-zero value in conditions of sideways trading. Due to the EMAs small periods, their crossovers achieve good results during strong breakouts and overall strong moves. Their main disadvantage is that they produce many false signals during trading ranges and, second, because moving averages are a lagging indicator, they have little predictive value. Thus, the trader needs to constantly keep an eye on his opened position and act as market conditions shift. Check out the following example.

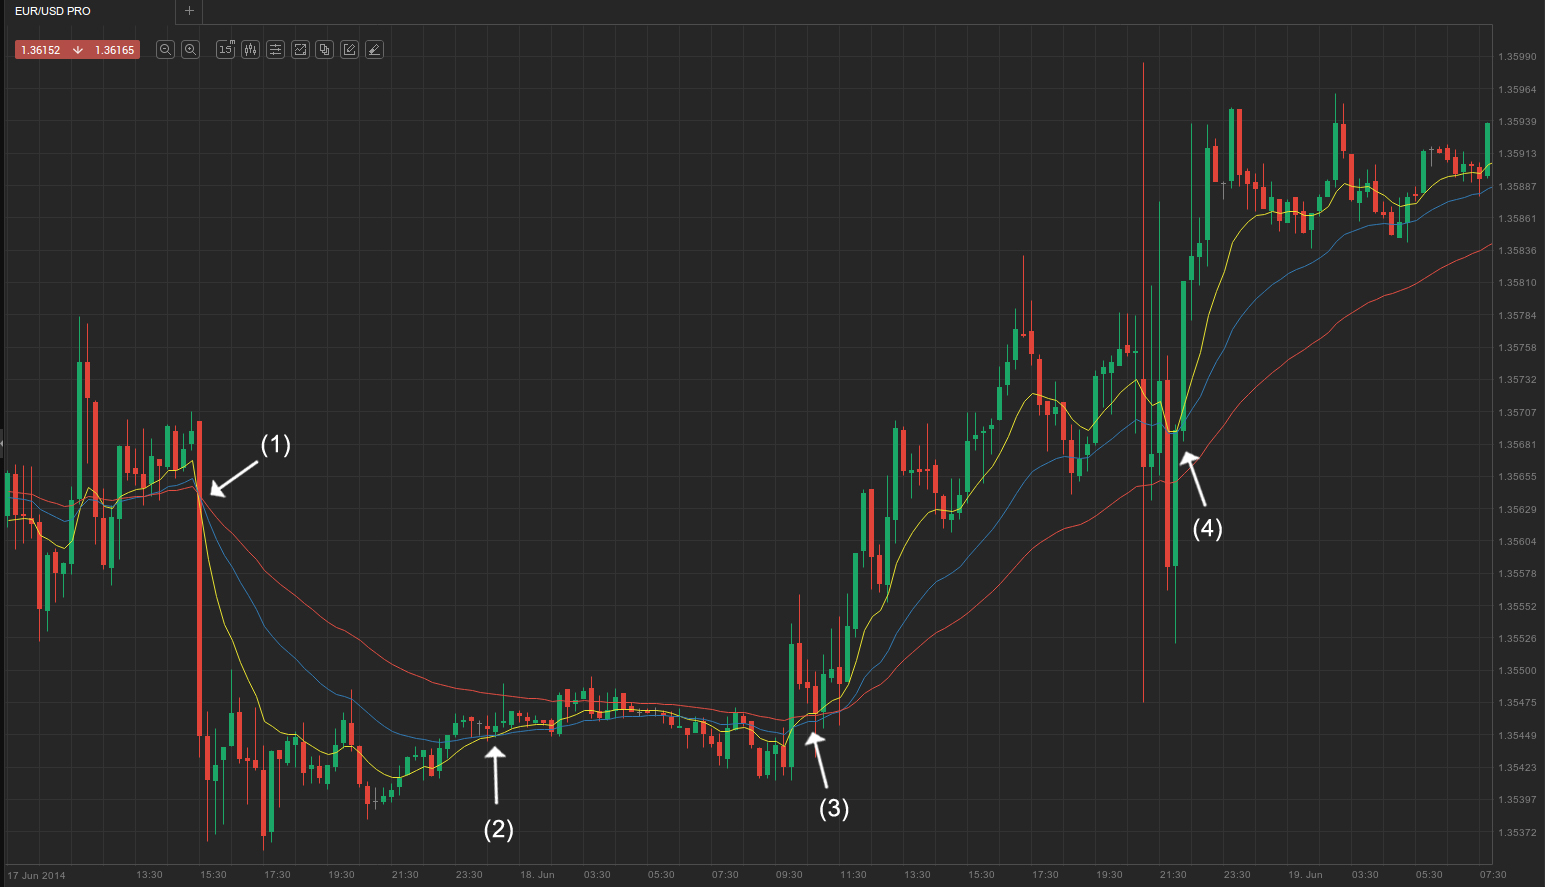
As you can see on the 15-minute chart example above, the 10-period EMA (yellow) crossed the other two (blue – 25-period, and red – 50-period) on several occasions. First, at (1), the EUR/USD cross marked a major decline on the base of an economic data release, causing a fast moving average crossover. Traders who would wait for a confirmation (a bar closing below the 50-period EMA) would enter at the close of the big bear trend bar, while some may have dropped to a lower time frame (10 or 5 minutes) and search for a close there. They would then have exited either at (2) where the 10-period EMA crossed the 25-period essentially at breakeven, or at bar (3) which would have been a loss. This stands to show how fairly ineffective this trading system is during conditions of sideways trading (the market was in a trading range prior the breakout at (1) and almost immediately after the climactic bear trend bar it entered a barbed wire trading range).
Our example, however, provided us with an EMA crossover in trending conditions as well. At (3), the 10-period EMA crossed above both slower EMAs shortly after a big bull trend bar broke out of the tight trading range. The following bull trend would become evident after the formation of three very strong bull trend bars. Here is how the trend unfolded afterwards.

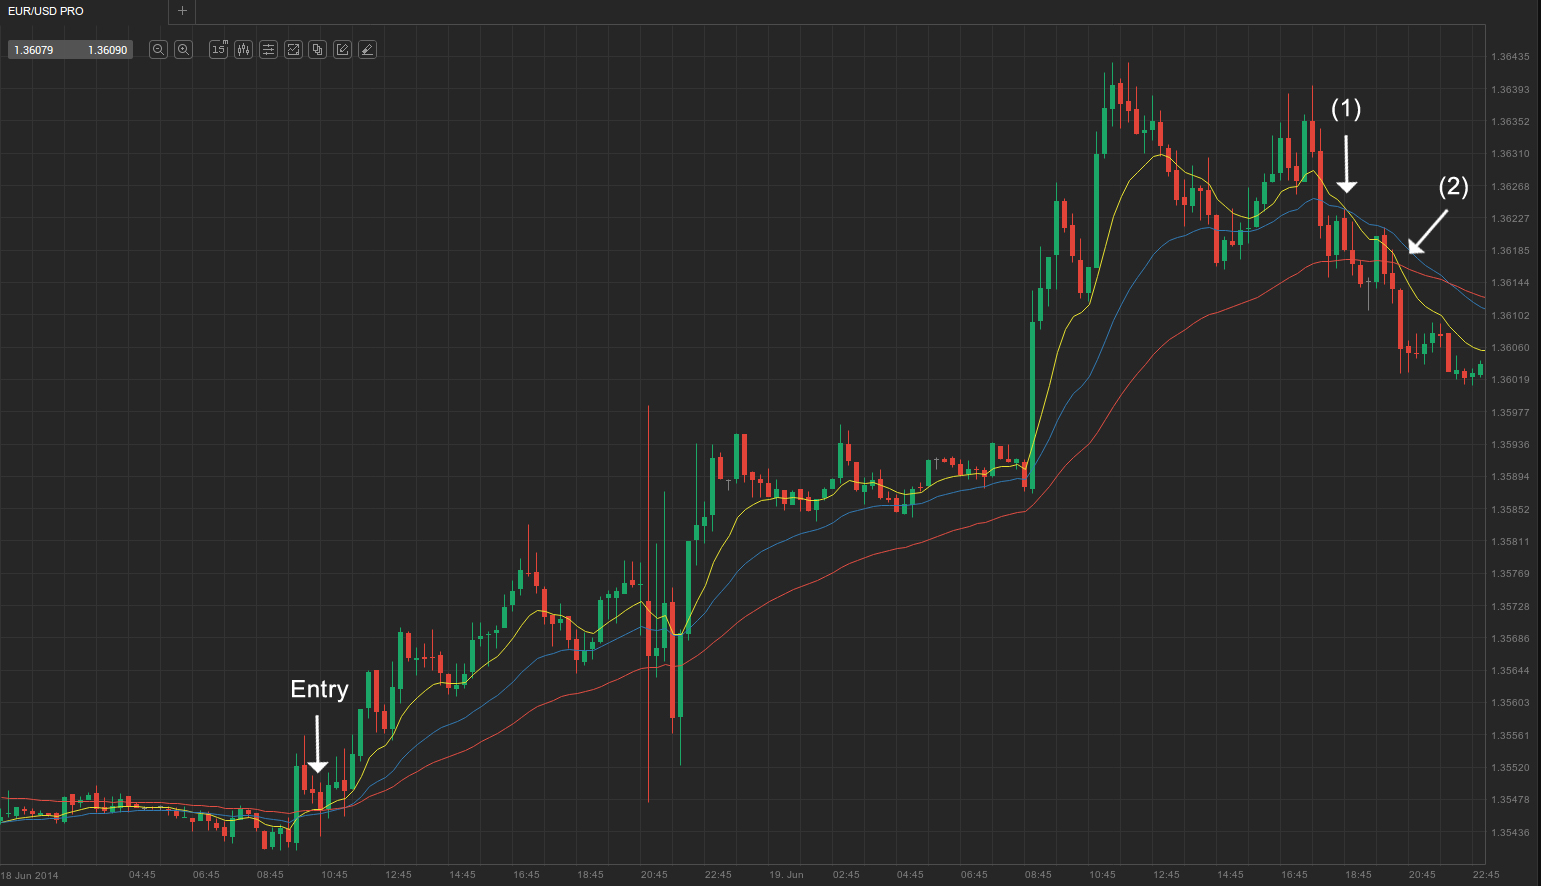
As you can see, our entry was around the 1.3550-1.3552 area. The 10-period EMA did not cross below the 25-period EMA up until (1), where some traders would have closed their positions. Alternatively, some who hoped the upward move will be extended would have waited for a 50 EMA crossover, which happened at (2) and the first bar below it closed at 1.3605. Even with the riskier exit approach, you would have earned little over 50 pips.