Combining the Average True Range and the Simple Moving Average envelope
You will learn about the following concepts
- Indicators used with this strategy
- Signals to be looking for
- Entry point
- Stop-loss
- Profit target
For this strategy we will be examining the daily chart of EUR/AUD. The indicators we will be using are the 20-period Simple Moving Average (SMA) with a 0.5% envelope set and the 14-period Average True Range (ATR).
A trader needs to examine the price action, looking for eventual breaches from the two bounds of the envelope. In case a candle manages to break and close above the upper bound of the established envelope, the trader will look to go long at the open price of the next candle. The protective stop will be placed in accordance with the ATR of the signal candle, or if the ATR is 70, then the stop will be at a distance of 70 pips below the entry price. If the stop is triggered, the trader will wait for another signal (buy or sell) to appear. If the trade is developing in his/her favor, the trader will keep the position active until the opposite signal (sell) appears.
In case a candle manages to break and close below the lower bound of the established envelope, the trader will look to go short at the open price of the next candle. The protective stop will be placed in accordance with the ATR of the signal candle, or if the ATR is 110, then the stop will be at a distance of 110 pips above the entry price. If the stop is triggered, the trader will wait for another signal (buy or sell) to appear. If the trade is developing in his/her favor, the trader will keep the position active until the opposite signal (buy) appears.
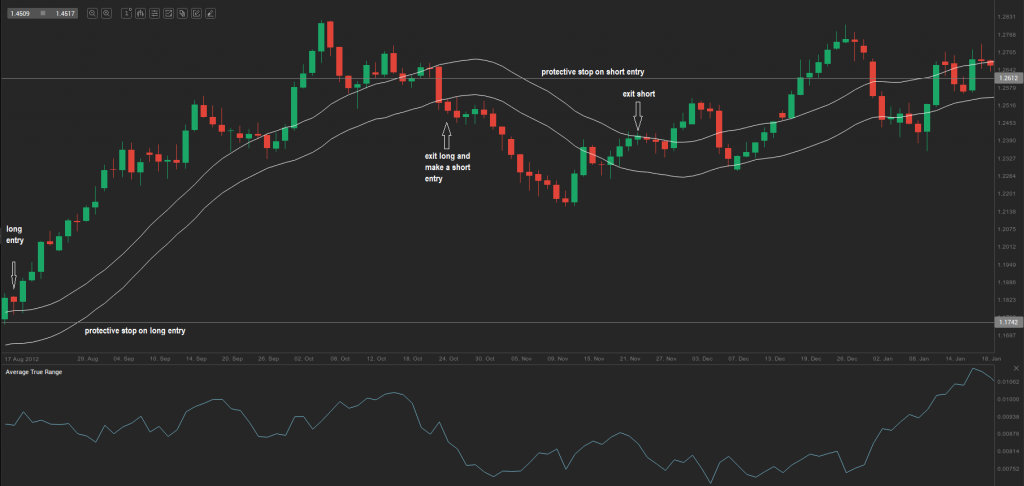
Let us take a look at the daily chart of EUR/AUD below.
On August 19th 2012 the price breached the upper bound of the envelope. This is the signal-providing candle. Its ATR is 91. We make a long entry at the open price of the next candle (August 20th 2012), or at 1.1833. The protective stop will be placed 91 pips below the entry, or at 1.1742. On October 24th 2012 the price breached the lower bound of the envelope. This is the signal-providing candle with an ATR of 85. On October 25th 2012 we close our long position at 1.2527 for a profit of 694 pips and make a short entry at the same price level. The protective stop will be placed 85 pips above the entry, or at 1.2612. On November 22nd 2012 the price breached the upper bound of the envelope and we closed the short position on the next candle (at the open of November 23rd 2012, or at 1.2394) for a profit of 133 pips.
