MetaTrader 4 Strategy Tester – Overview
This lesson will cover the following
- Positioning
- Contents
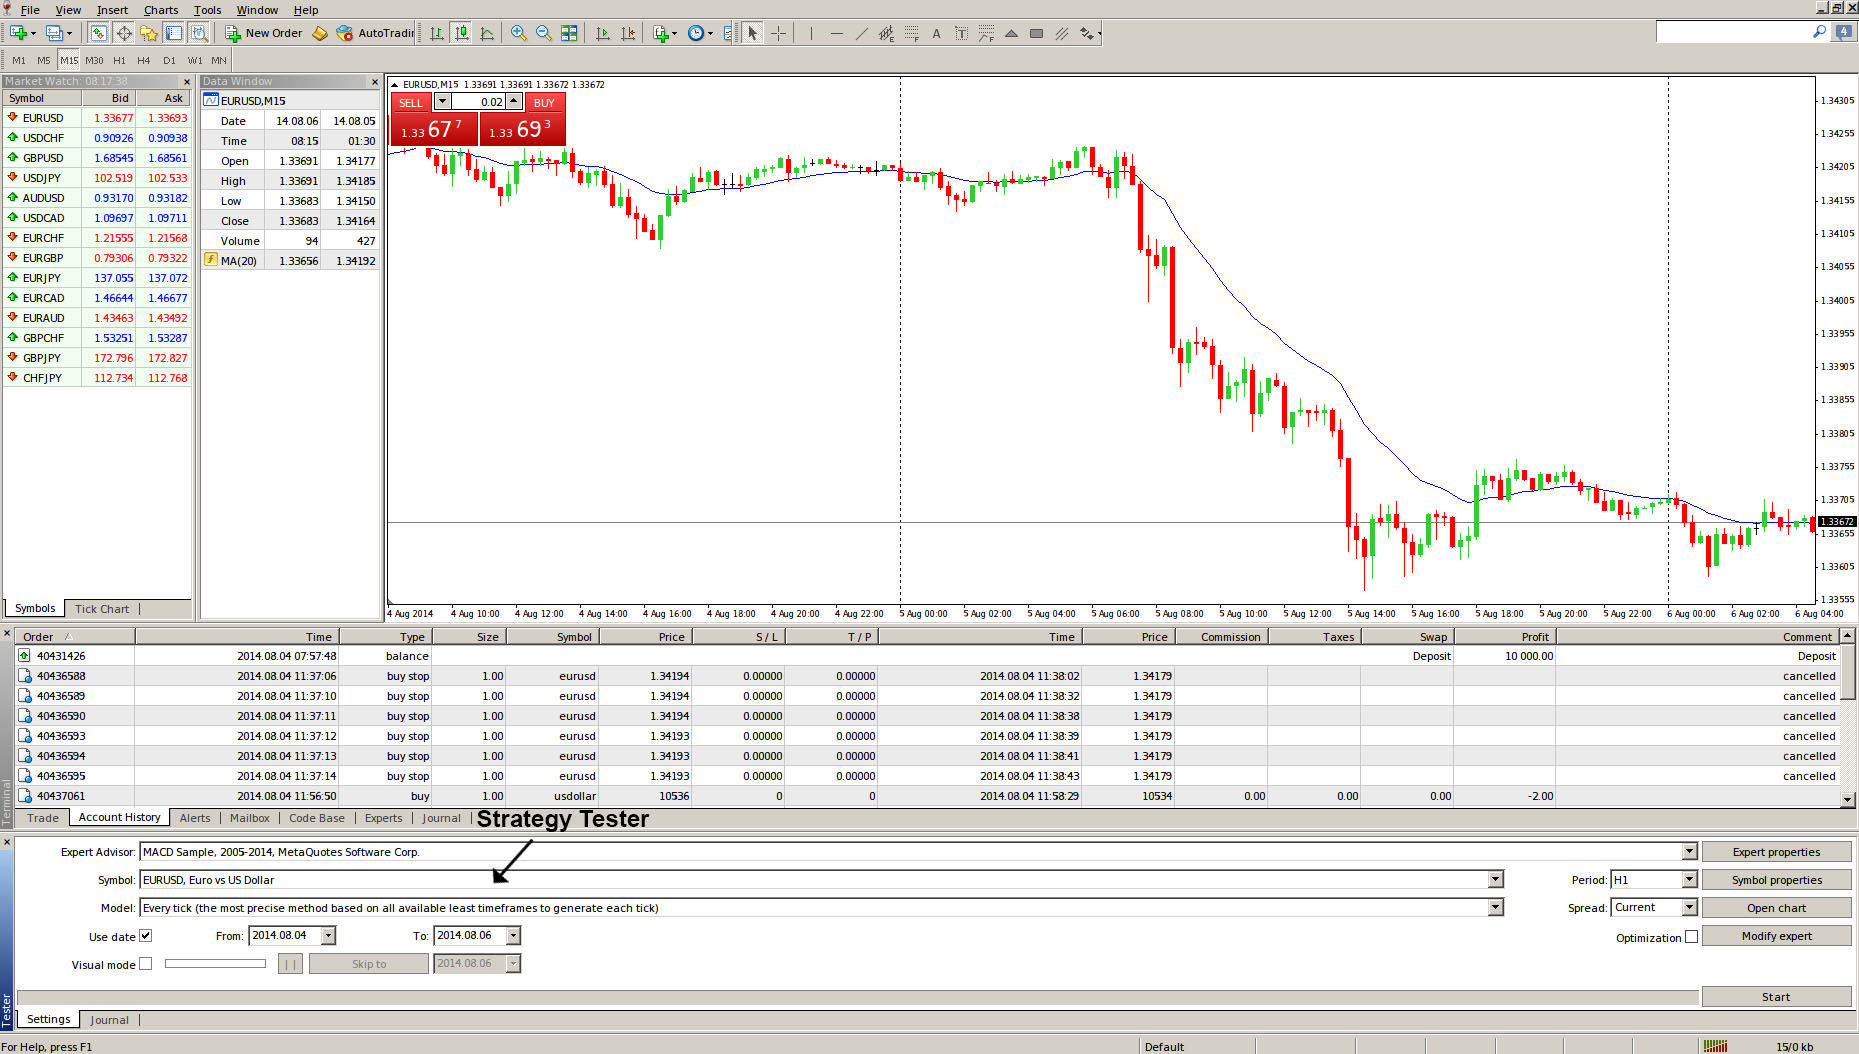
MetaTrader 4 has an in-built strategy testing tool, called Strategy Tester, which allows you to simulate strategies and optimize the parameters of expert advisors. As we have explained before, the Strategy Tester window can be brought up by hitting View >>> Strategy Tester, by pressing the Ctrl+R hotkey combination or by clicking on the ![]() button in the “Standard” toolbar. Below you can see the windows positioning in the platform.
button in the “Standard” toolbar. Below you can see the windows positioning in the platform.
The Strategy Tester has two tabs at first – Settings and Journal, and once you have concluded a test, several more appear.
– Settings tab includes the settings of testing and optimization. The parameters of expert advisors, period to be tested, the method of bars modeling, and many other things, can be tweaked in this tab.
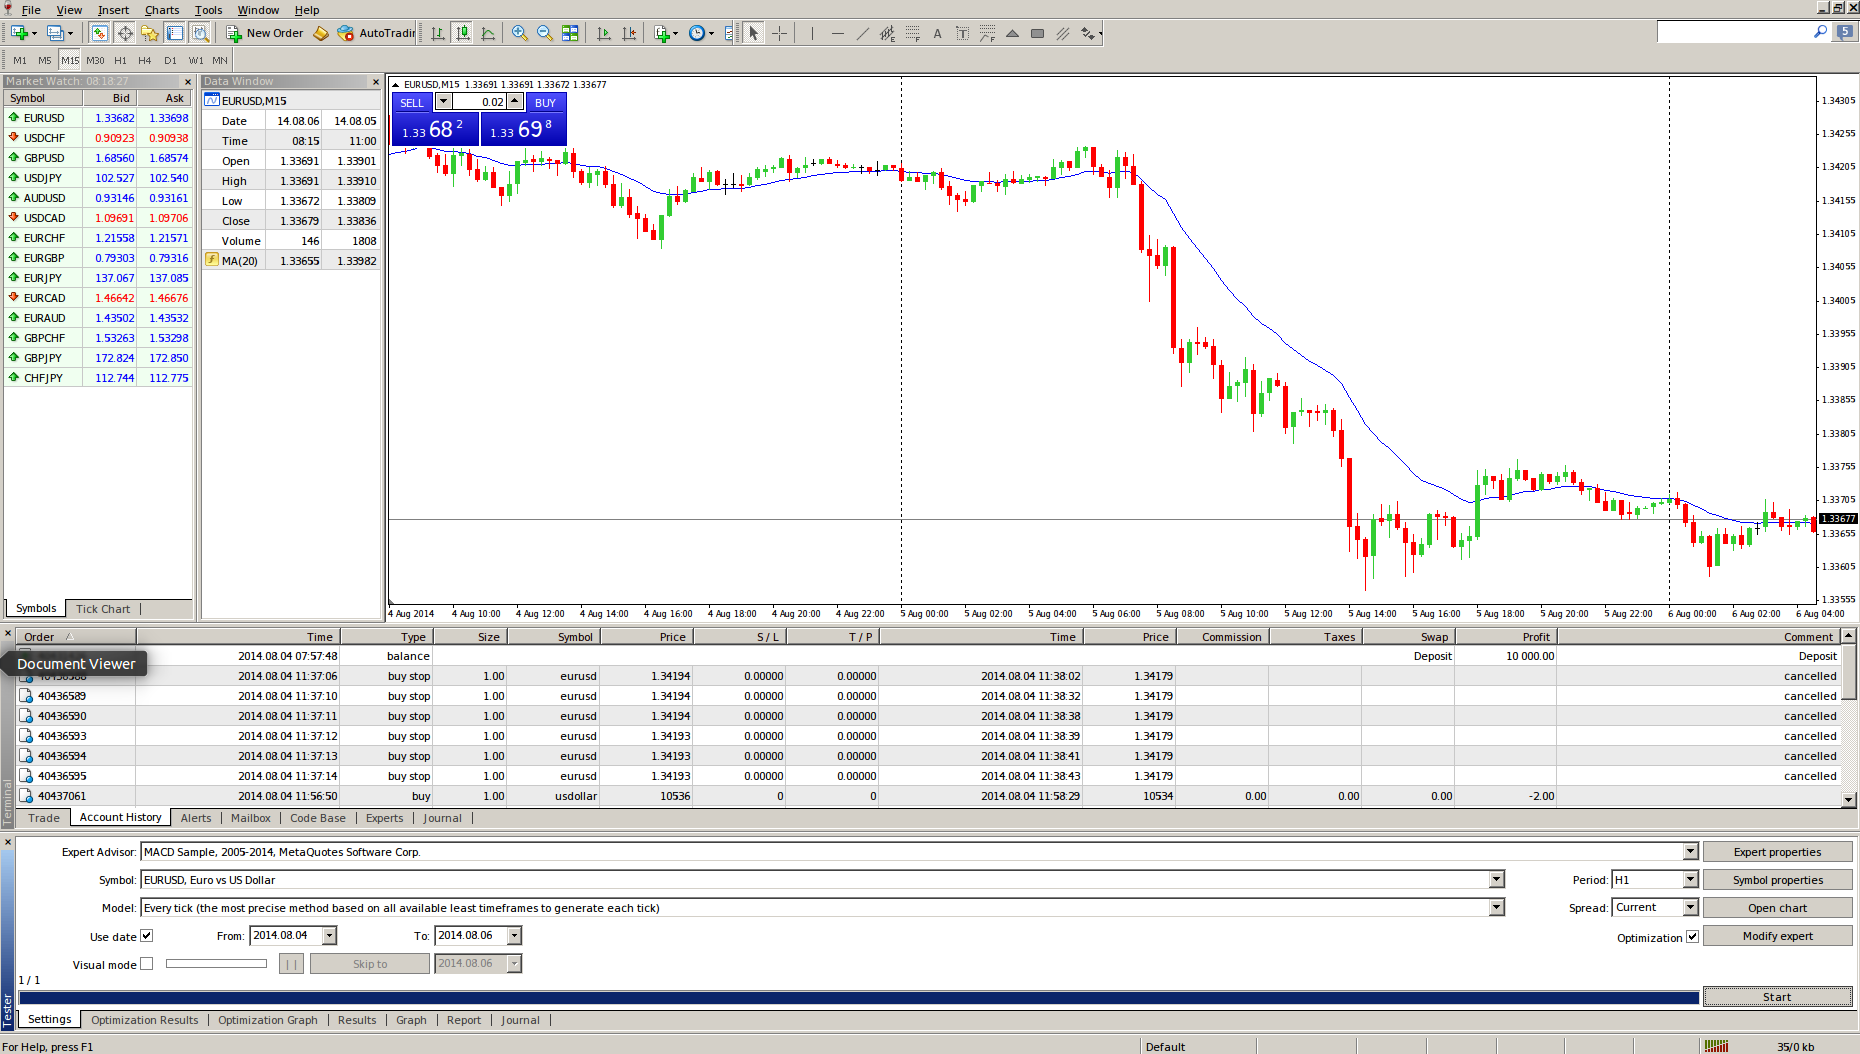
– Results contains the results of trade operations performed by the expert, as well as the direction of balance changes.
– Graph tab displays the testing results in a graph.
– Report section shows the detailed testing report. Indications of testing and effectiveness of experts can be found here: the amount of bars modeled, the total profit, the most profitable and unprofitable positions, the amount of winning and losing trades, etc.
– Journal tab contains a log where all actions and internal messages of the expert are recorded.
– Optimization Results holds information about every pass, including inputs, profitability, drawdowns, and other data.
– Optimization Graph tab shows the results of expert optimization as a graph. Besides each pass profitability, the amount of winning and losing trades is displayed in the graph. As we said, initially, only the tabs of “Settings” and “Journal” can be seen in this window. The tabs of “Results”, “Graph”, and “Report”, will only appear after an expert has been tested. After it has also been optimized, the tabs of “Optimization Results” and “Optimization Graph” will appear. Below you can see a screenshot with all the tabs after a test and an optimization have been run.

