MetaTrader 4 Chart Management – Setup
This lesson will cover the following
- Positioning
- Options
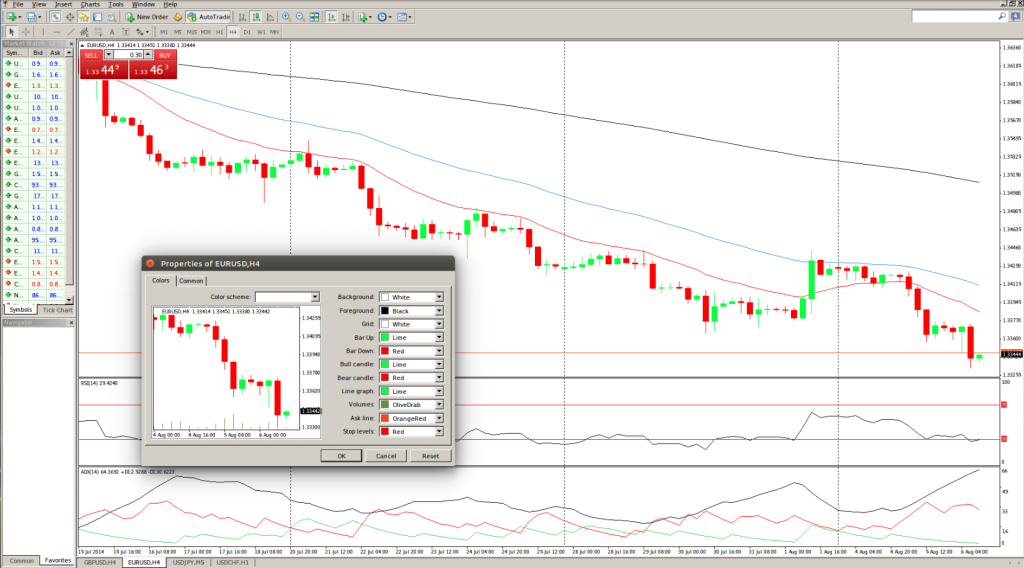
One can set up the appearance and properties of every chart in the terminal individually. In order to do so, he/she needs to execute the “Charts Properties…” menu command, the chart context menu command of the same name, or press F8. These actions call the “Properties” window, that can be used for setting the color of
a variety of elements on the chart:
1. Background – the color of the chart background.
2. Foreground – the color of axes, scales, OHLC line.
3. Grid – the color of the chart grid.
4. Bar Up – bar up, shades and fringing of the Bull Candle body.
5. Bar Down – bar down, shades and fringing of the Bear Candle body.
6. Bull candle – the color of the Bull Candle body.
7. Bear candle – the color of the Bear Candle body.
8. Line graph – line chart and doji.
9. Volumes – volumes and levels of active positions.
10. Ask line – the color of the Ask line.
11. Stop levels – levels of Stop Loss and Take Profit orders.
The changes made are automatically shown in the left part of the window in the preview chart. Except for manual setting of various color elements of the chart,
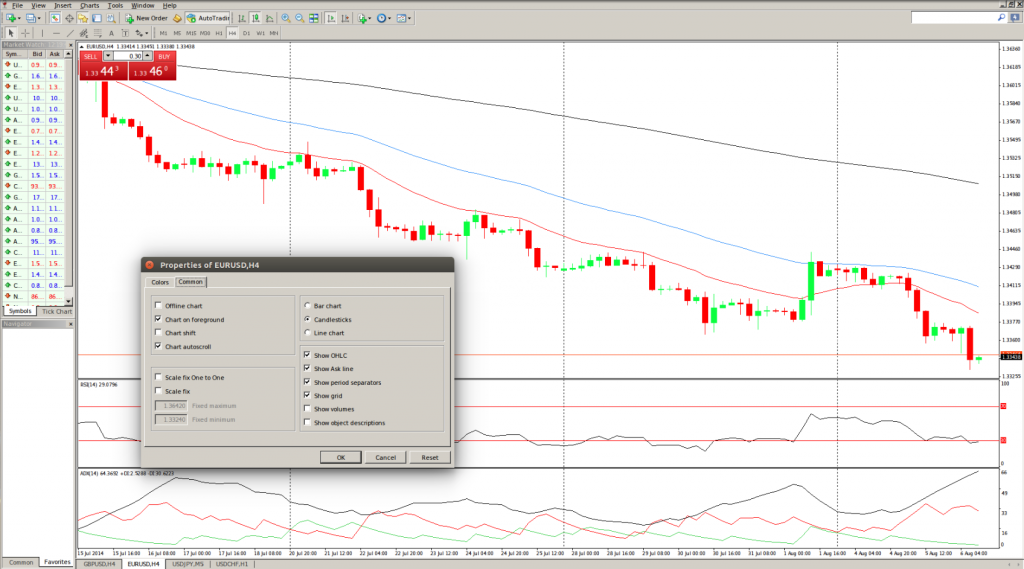
one can choose pre-defined color diagrams in the field of the same name. One can choose from three color diagrams in the terminal: “Yellow on Black”, “Green on Black” and “Black on White”. After a color diagram has been chosen, the chart elements, described above, will change in the chart in the left part of the window. Custom color diagrams can be stored in templates, while other chart settings can be defined in this window as well. In order to do so, one needs to switch to the “Common” tab and select from the following options:
– Offline chart – turns the chart offline. This option terminates receiving and drawing of price data for the particular chart. At some time in the future, after this option is disabled, price data will be drawn in the chart again. After the chart has been opened offline, using the “File – Open offline” menu command, this option will be enabled automatically.
– Chart on foreground – puts the chart in the “foreground”. If this option is enabled, all analytic objects will be placed “under” the price chart. This command has the same effect as that of “Charts – Foreground chart”.
– Chart shift – shifts the chart from the right border of the window to the shift mark. The chart shift mark (a grey triangle in the upper part of the window) can be moved with the mouse horizontally within 10% to 50% of the window size. This option can also be enabled by pressing the ![]() button from the “Charts” toolbar or by using the “Charts – Chart Shift” menu command.
button from the “Charts” toolbar or by using the “Charts – Chart Shift” menu command.
– Chart autoscroll – allows/forbids shifting the chart to the left automatically after the new bar has begun to appear. If this option is enabled, the latest bar will always be presented on the chart. This option can also be enabled by pressing the ![]() button from the “Charts” toolbar and by using the “Charts – Auto Scroll” menu command.
button from the “Charts” toolbar and by using the “Charts – Auto Scroll” menu command.
– Scale fix One to One – fixes the chart scale as “one to one”. Or, the size of one pip of the vertical axis in pixels is equal to the distance between the bars axes in pixels. Upon execution of this command, the “Scale fix” option will be enabled automatically, while a scroll bar will appear at the right side of the window, allowing one to move the chart vertically. This mode is needed for precise constructions.
– Scale fix – fixes the current chart scale. If the scale has not been fixed, the chart will be automatically scaled vertically. This option disables automatic scaling and fixes the current scale. When one chooses this option, the fields of additional scaling parameters “Fixed maximum” and “Fixed minimum” will be activated.
– Bar chart – displays the chart as a string of bars. This action can also be performed by pressing the button from the “Charts” toolbar, by using the “Charts – Bar Chart” menu command or by using the key combination of Alt+1.
– Candlesticks – displays the chart as a string of candles. This action can also be performed by pressing the button from the “Charts” toolbar, by using the “Charts – Candlesticks” menu command, or by using the key combination of Alt+2.
– Line chart – displays the chart as a broken line, connecting the points of bars closing prices. This action can also be performed by pressing the ![]() button from the “Charts” toolbar, by using the “Charts – Line Chart” menu command, or by using the key combination of Alt+3.
button from the “Charts” toolbar, by using the “Charts – Line Chart” menu command, or by using the key combination of Alt+3.
– Show OHLC – shows/hides OHLC line. If this option is checked, an additional data line will appear in the upper left part of the window. Except for instrument name and chart period, the latest bar prices are listed in it. Prices are recorded in the following format: OPEN, HIGH, LOW and CLOSE (OHLC) – bar open price, the highest bar price, the lowest bar price, and bar close price. This way precise value of the latest bar can always be seen. This option also influences the data line of sub-windows of indicators.
– Show Ask line – shows/hides Ask price level of the latest quote. Bars are drawn and shown using only the Bid prices in the terminal. However, when opening long positions and closing short positions, the Ask price is always used. It is not shown on the chart in any way, so one cannot view it. In order to control ones trading activities more precisely, he/she can enable the “Show Ask line” parameter. After the execution of this command, an additional horizontal line will appear on the chart, which corresponds with the Ask line of the latest bar.
– Show period separators – shows/hides period separators. Date and time of every bar are presented on the horizontal axis of the chart. This horizontal scale interval is actually the selected time frame. The “Show period separators” option places additional vertical lines on the chart, which correspond with the larger time period (time frame). For example, daily separators will be drawn for charts with time frames of M1 to H1, weekly separators for H4, monthly separators for D1, and yearly separators for W1 and MN1.
– Show grid – shows/hides the grid in the chart window. The same actions can be performed by using the chart context menu, “Charts” menu
command of the same name and also by using the key combination of Ctrl+G.
– Show volumes – shows/hides the volume chart in the lower part of the window. This option does not function when the scale is fixed. The same actions can be performed by using the chart context menu and “Charts” menu command of the same name and also by using the key combination of Ctrl+L.
– Show object descriptions – shows/hides object descriptions on the chart. If this option is enabled and there are descriptions of objects imposed into the chart, they will be shown directly on the chart.

