Trends from the start of the trading day – examples
This lesson will cover the following
- First pullback during a strong uptrend is an appropriate long entry
- Trend from the start showing little pulling back
- First breach of a key trend line usually does not succeed
First pullback during a strong uptrend is an appropriate long entry
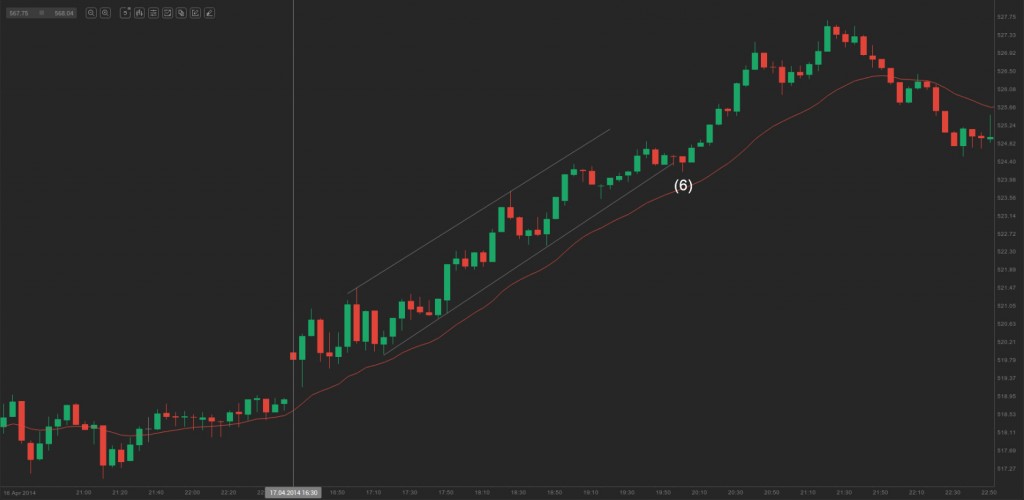
On the 5-minute chart of AAPL above we can see that the market has begun a strong uptrend from the start of the trading day. There has been a bull channel and a breach of the bull trend line at bar 6, which has been the first pullback in the trend. Traders have probably gone long on a stop a few ticks above the high price of bar 6, regardless of the fact that it has been a weak signal (a bearish close, but yet a close above the midpoint of the bar). Traders, using a more aggressive approach, have probably bought on a limit order at the low price of the bar, preceding bar 6. They have probably expected a failed breakout below the bull trend line and a move to higher price levels.
Some traders might have considered it reasonable to go short below the opening bar of the day, because it has been a bear trend bar. There has also been a gap up and some space to the exponential moving average and to the close of the previous day. However, most of these traders would not have been able to change their mindset fast enough and reverse their positions to long above bar 6. They would have waited to go long above the first pullback, while this later entry would have cut their profits by a few points.
Small pullback uptrend day
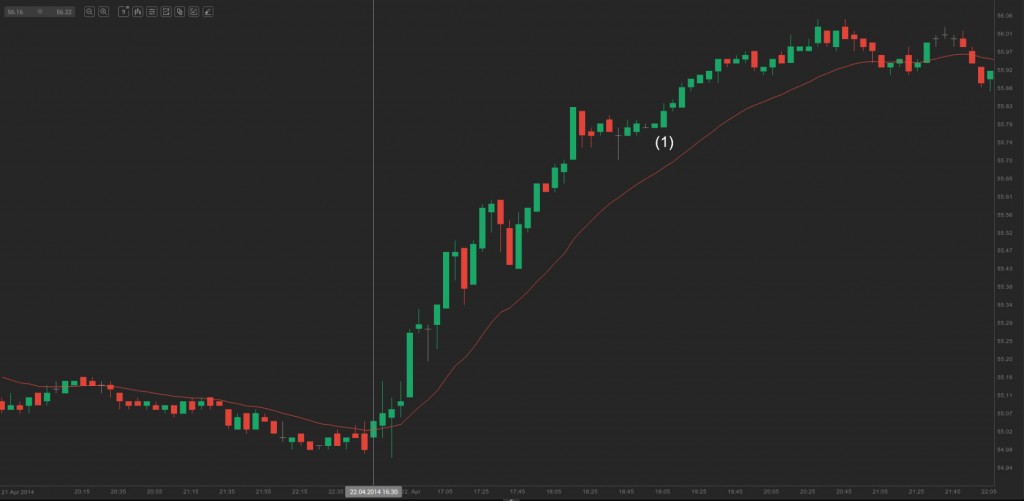
On the 5-minute chart of J. P. Morgan Chase (JPM) we can see that the market has entered an uptrend from the start of the day, which demonstrated small pullbacks. In case all of the pullbacks are less than 25% of the recent average daily range, the trading day is a small pullback day. Any sideways move was a pause, respectively a type of pullback and a setup to go long. The breakout at bar 1 from the two-legged sideways correction was a good entry.
First breach of a key trend line usually does not succeed
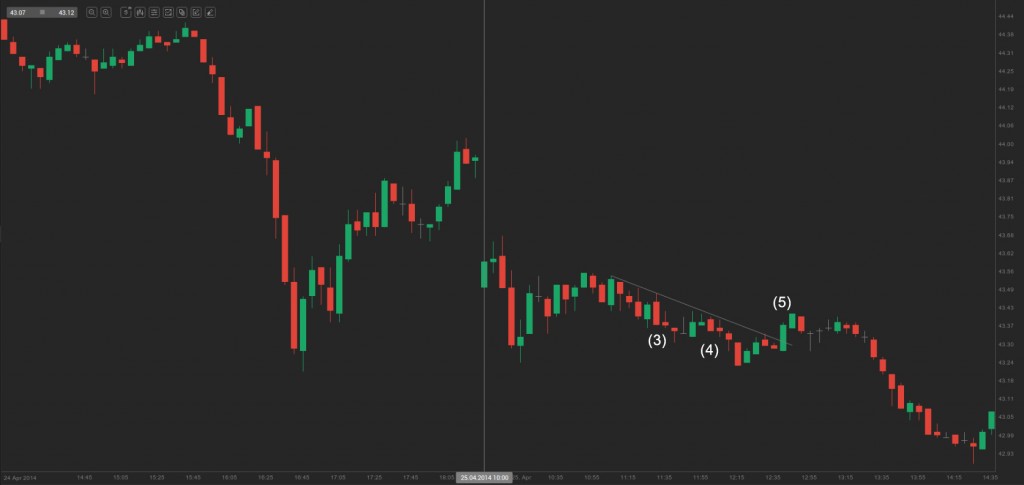
On the 5-minute chart of Societe Generale (GLE) bars 3 and 4 were tiny pullbacks, which did not manage to breach a key bear trend line. The first pullback to break this line was actually bar 5. The first breach of a trend line has a good chance to be followed by another leg of the trend. Therefore, it provides a good opportunity to make an entry in the market. In this case going short below the low price of bar 5 would have been a profitable trade. Very often unclear pullbacks imply that traders against the trend are in fact weak, while to determine which pullback is the first meaningful one is not that easy.


