Wide channel trends
This lesson will cover the following
- What are the wide channel trends
- What do they consist of
- What type of positioning traders use
- Profit targets
Previously in our guide we dedicated time to explain some of the characteristics of trending trading ranges and now we will turn our attention to a variety of those overall weak trends – the wide channel trend, or as some refer to it – stairs.
This is basically a succession of at least three trending ranges where the market is marking wide swings, but it is nevertheless displaying trending extremes. The broad swings allow market participants to trade both with- and counter-trend, but as weve always advised, inexperienced traders are best to stick to with-trend positioning.
This type of market behavior consists of successive breakouts, which are followed by pullbacks that exceed the breakout point (there is overlap), but remain below the previous swing high (or above the previous swing low in a bullish trend). This type of movement closely resembles stairs going down or up. Very often you can see a couple of pullbacks extending beyond the most recent extreme high or low by a little, trapping some traders who think the trend is reversing, but it usually resumes afterward, given there was only a minor break of the trend line.
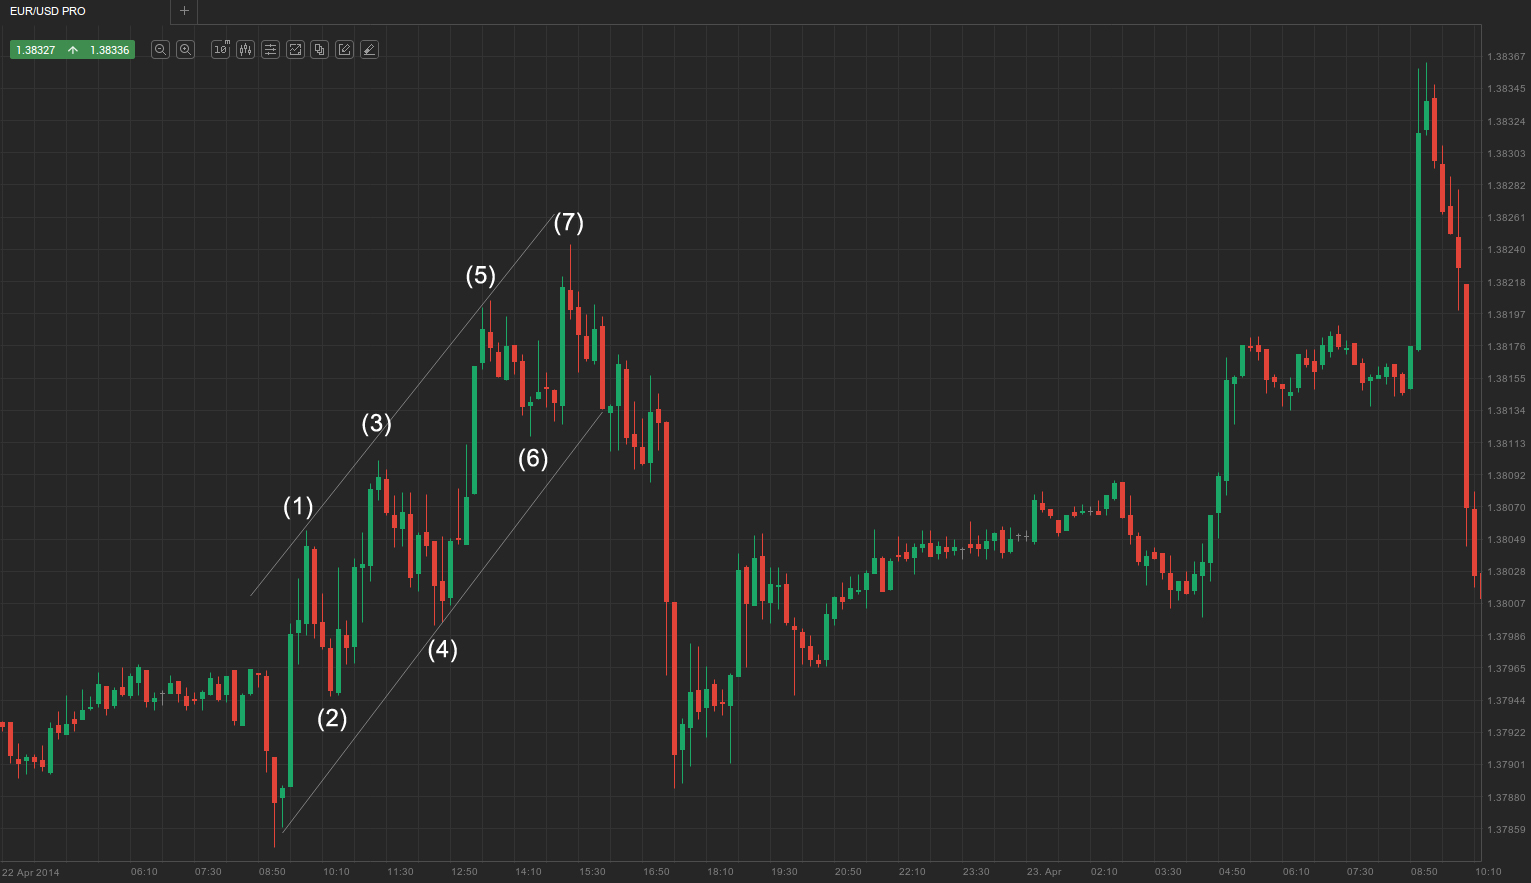
As you can see on the screenshot above, the breakout to bar (3) marked a new high above bar (1), and the pullback to bar (4) retreated beyond the breakout point (bar 1), but remained above the low of bar (2). Furthermore, the leg to bar (5) was a breakout above the previous high at bar (3), while the pullback to bar (6), although it failed to reach back to the breakout point, also marked a higher low above bar (4). The next move to bar (7) marked a new high but it was also a shrinking stair, because the move from bar (5) to bar (7) extended less than the move from bar (3) to bar (5). This suggests that market momentum is waning and a reversal or a trading range might be upcoming. And so it did. The pullback from bar (7) extended beyond the breakout point, but it also broke the trend line after a strong down-shaved bear trend bar.
Sideways trading is possible
Because this is not a spike and channel trend, rather a weaker one, traders are provided with the opportunity to enter positions in both directions. However, because the market is still forming trending highs and lows, i.e. there is a weak trend in motion, either bulls or bears are overpowering the other side at least to some extent. Moreover, if each successive breakout is smaller than the preceding one, this is a sign of faltering momentum which usually precedes a greater correction, usually a two-legged retracement, which breaks through the trend line.
Sometimes you can also see a breakout (a stair) unexpectedly overshooting the trend channel line. If the price continues in the same direction after the breakout (with-trend), it will continue for at least two more legs, matching the height of the channel. If the market however reverses back in the counter-trend direction, this would likely be a two-legged move.
Profit target
Due to the repeatability of the stairs patterns components, traders are able to relatively accurately measure their profit targets in both with- and counter-trend direction. In a bear trend for example, they measure the distance between the last swing low and the one before it, in order to assess when to enter a long position during the next downward breakout. If for example the last low was 20 pips below the one preceding it, traders will go long at around 15 pips below the last swing low so that they can position themselves in advance for the upcoming pullback. This usually overall matches the trend channel line.
Afterward, they will determine their profit target in accordance to the length of the pullback from the last breakout. If the market pulled back, say 18 pips, they will go for a profit target of around 14-18 pips, overall matching the trend line.
Some traders dont use these exact measured numbers, rather go short at the trend line and go long at the trend channel line in a bear trend, and vice versa. However, more experienced traders use strictly measured moves and place limit orders.
Generally, when a stairs pattern is present, for example bull stairs, you can usually counter-bet scalp the close of each strong trend bar breakout (sell each strong bull trend bar which closes above a prior bull stair). The opposite is true in a bear trend. However it is safer to first wait for the market to reverse and then enter on a stop below the previous bar.
Waning momentum
We mentioned before that during a stairs pattern, if the market begins to form smaller successive breakouts, this signifies slowing momentum and precedes a larger correction, or even a trend reversal. It closely resembles a successful wedge. Some traders call this pattern shrinking stairs. Take a look at the following example.
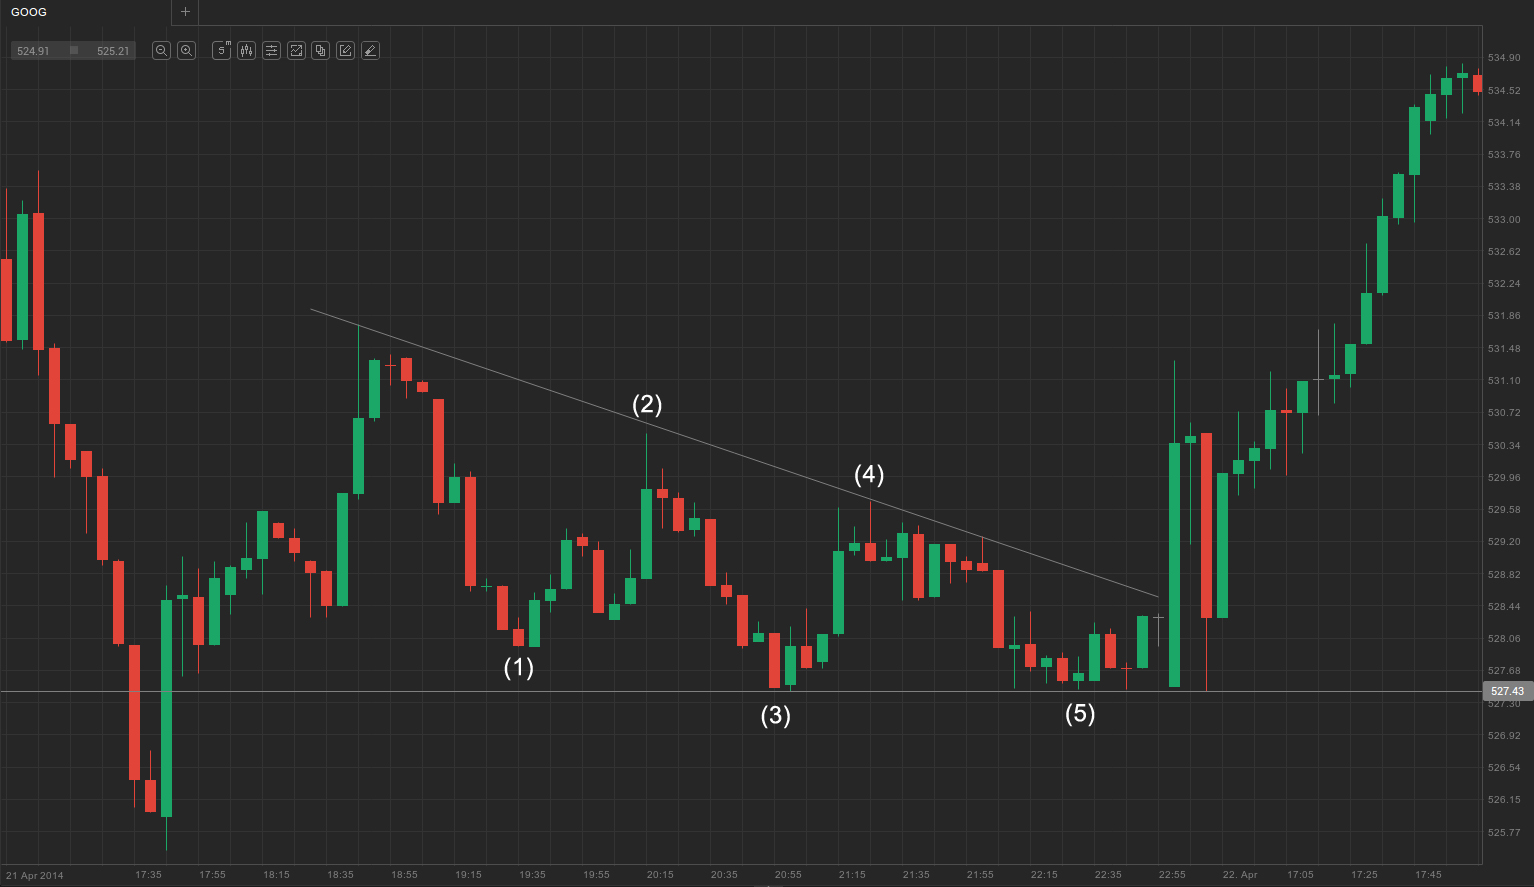
As you can see, the market made a correction after a significant sell-off, which was the beginning of a bear stairs pattern. The first stair made a lower low at bar (1), after which the pullback to bar (2) was below the high of the first stair. The leg to bar (3) marked a lower low and the pullback to bar (4) exceeded the breakout point. However, the next stair of the pattern, down to bar (5), not only failed to keep up the declining pace from bar (1) to bar (3), but it also failed to penetrate the support level of bar (3), thus turning the pattern into shrinking stairs and giving a hint an upward breakout might be on the way.
Although the stairs pattern is a variation of the trending trading ranges, which is basically a weak trend, sometimes this pattern can also precede the formation of a strong trend in the same direction, i.e. accelerate. This is a typical scenario when a wedge fails.

