Hello there, this is tradingpedia.com and in this video deals with Elliott Waves Theory. We come back to the Elliott Waves Theory as there are some things we didn’t mention so far. Actually, there are many more things to discuss, but today we will expand the notion of flat patterns.
Overview
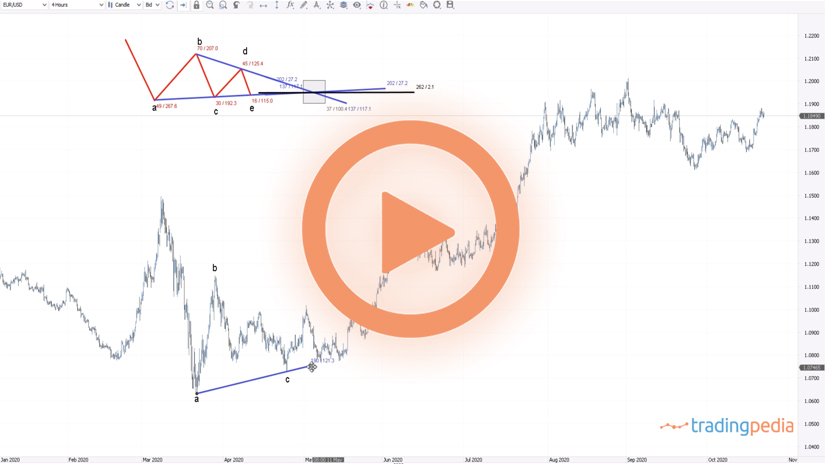
So far, we have discussed flats with weak b-waves but this time we will cover flat patterns with normal b-waves. A flat is a three-wave structure – a-b-c. This is wave a, and then the market reverses from that point into wave’s a territory and forms a flat pattern – an a-b-c. Any flat pattern is labeled with letters.
When you look at it, you see a corrective wave for waves a and b and an impulsive move for the c-wave. This is the general structure for a flat pattern and we already covered this on previous videos here on tradingpedia.com. At this point in time we want to emphasize the different types of flats and to do so we must consider the retracement level for the b-wave. Namely, the b-wave must retrace beyond 61.8% of the previous wave a.
Measure the Length of Wave
Therefore, all we have to do is to measure the length of wave a and then to look at the b-wave. If it retraces between 61.8% – 80% of wave a, the flat patterns are called flats with a weak b-wave. We already covered that. But if the b-wave retrace between 80% and 100% of wave a, it means that the market forms a flat with a normal b-wave.
If we take a Fibonacci tool and measure the length of wave a from its start to the end of it, and we see that the b-wave ends between 80% and 100% of wave a, that is enough for the flat to be to considered a flat with a normal b-wave.
What follows next? The type of the flats depends on the length of the impulsive wave – the c-wave. As such, we have three possibilities.
One possibility is that the c-wave or the impulsive wave fails to fully retrace wave a. When this happens, the market forms a flat with a c-failure. This is typically the longest wave in time in the entire pattern.
Another possibility is when the c-wave fully reverses the previous b-wave and ends between 100% and 123.6% when compared to the length of the b-wave. In this case, the market forms a common flat. This is a very “common” pattern on the FX market and the way to find out the end of the c-wave is to use again a Fibonacci retracement in relation to the b-wave. In this case, this is called a common flat and it means that the c-wave is longer than 100% of wave b but not much more than 123.6%.
The third and last possibility is called an elongated flat and during an elongated flat the c-wave is longer than 161.8% when compared to the previous b-wave. Therefore, if we clone this one and apply it from the end of the b-wave, the longer c-wave makes an elongated flat. The length of the c-wave must exceed 161.8% when compared to the length of the b-wave.
Related Videos
Types of Flat Patterns
These are the three types of flat patterns that appear in the category of normal flats. Out of these three types the most common pattern is the common flat, as the name suggests. Next, the elongated flat and then the c-failure. Out of the three, all the c-waves are impulsive.
However, when you see the c-wave of a flat with a c-failure, you think of a terminal impulsive wave and not a classic one.
The EURGBP here offers a great example. The market bounced here, came back, and then exploded higher. So, what kind of a flat the market formed? If we look at the lows in this area and then the move that followed is clearly a corrective one and retraces almost entirely the a-wave. The c-wave should be the impulsive wave.
So, what do we do next? We find out the category the flat is – in this case, a flat with a normal b-wave. And then we measure the length of the b-wave using a Fibonacci retracement tool, from its start until its end and we see the length of it.
We see that the c-wave exceeded 138.2% and almost reached 161.8%. Therefore, this is an elongated flat. Remember, the c-failure does not retrace more than 100% of the b-wave. The common flat doesn’t go more than 123.6% of wave b, but the elongated flat goes more than 123.6%, more than 138.2% and very often more than 161.8%.
So, this is an elongated flat part of a complex correction, an elongated flat part of the category of flats with normal b-waves.
Let’s move on with the next category of flat patterns – bye, bye.
