Hello there, this is tradingpedia.com and this video deals with two reversal patterns, or only one, depending how you look at it, that belong to Japanese candlesticks patterns – piercing and dark-cloud cover.
Different Types of Patterns
All Japanese reversal patterns have an equivalent bullish or bearish “brother” or “sister”. For example, bullish and bearish engulfing – one forms at the bottom of falling trends and the other one at the top of rising trends.
In this case, the piercing forms at the end of a bearish trend, and the dark-cloud cover at the end of a bullish trend. In the first instance we want to buy, and in the second we want to sell.
Before starting, these are very common patterns – more common than morning and evening stars, than engulfing, etc. They form everywhere, on all timeframes and markets.
This is a two-candlestick pattern. In a bearish trend, the market forms one candlestick with a regular real body – small or large, with a shadow or not. What matters is that a second candlestick forms and instead of totally engulfing the previous one, it must travel more than 50% into its territory and close there.
So, if it goes like this, this is not a piercing pattern, but like this, it is. In order to avoid transforming into an engulfing, it must not exceed 100% of the previous candlestick. Therefore, if it closes between 50% and 100% of the previous candlestick’s real body, that is your piercing pattern.
Again, the upper and lower shadows do not matter. They might exist or not. This is the piercing pattern and it is a bullish pattern.
The opposite is true. Imagine that the market is on a rising trend, you have a candlestick in the direction of the trend, and then an opposite candlestick forms that have a real body sufficiently strong that closes between the 50% and 100% of the previous candlesticks’ real body.
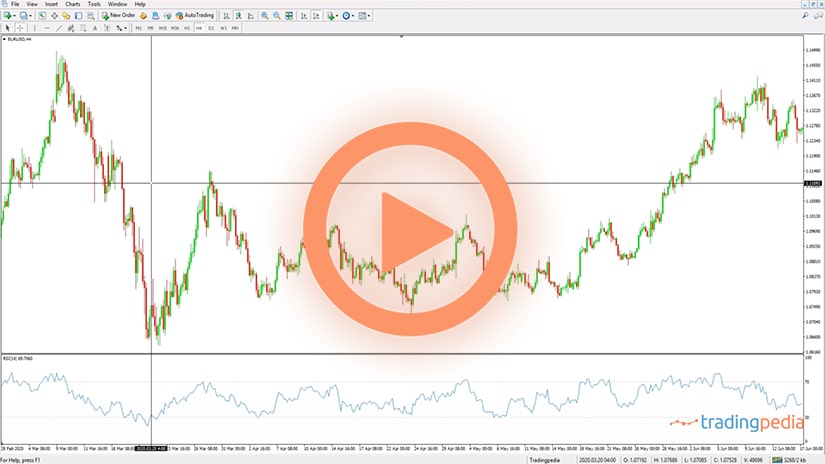
Let’s scroll down on the left side of the chart on the EURGBP 4h timeframe and remember that in this case this is a bearish pattern and we need to check a reversal pattern at the end of it.
This is not a dark-cloud cover because the second candlestick fails to retrace minimum 50% of the previous candlestick’s real body. But here we have a bearish trend and the market forms a bearish candlestick in the direction of the main trend.
Nothing signals that a reversal might be in cards. But another candlestick follows and closes more than 50% into the territory of the first candlestick. That’s a bullish pattern, a piercing, and if it would have formed here it was a dark-cloud cover.
Trading Tips
How to trade it? We take two horizontal lines and mark the top and bottom and find out 50%-61.8% retracement area. Aggressive traders may go for 38.2%, or so. We measure the risk, put a stop at the bottom and project it three times to the upside for a proper risk-reward ratio.
We go long here, we exit here – in one single candlestick we are filled, and the take profit comes. It is not always like this. Because these are such common patterns, you should expect that some will fail. But this is the reason why it is mandatory to use a 1:3 risk-reward ratio.
For instance, if you noticed on the right side of the chart, when we were searching for patterns, one situation came to mind. Namely, this one here.
This falls into the realms of a piercing pattern because it has all the prerequisites of a piercing pattern – a bearish candlestick and another one that follows. If we measure the high and the low and we look for 50%-61.8% retracement we see that we were barely filled to the upside. So, more conservative traders will wait for 61.8%, others not, but this retracement is not sufficient to warrant an entry to the long side.
As a matter of fact, it turned out to be a false break because the market reversed and took the lows. It is important because it tells us two things. One is to wait for the pullback. If in a Japanese candlestick reversal pattern there is no pullback, try to ignore it because the bears or bulls will always try to take control.
Second, consider the risk-reward ratio. Even if that we went long and don’t book the profits, and then the market takes the stop. No problem. But then on the next trade, or another trade similar to this one, we solve the problem. One loss and three times the profit – still enough profit when compared to the risk.
Related Videos
Sum Up
To sum up, piercings and dark-cloud covers form at the end of bearish, respectively bullish trend. Wait for the second candlestick to close into the territory of the first candlestick’s real body, then place a pending order at 50%-61.8% – the more the price retraces, the better, set a stop at the top or bottom and target a risk-reward ratio of minimum 1:3 as it often goes much more than that.
Thank you and have a great day. Bye, bye.
