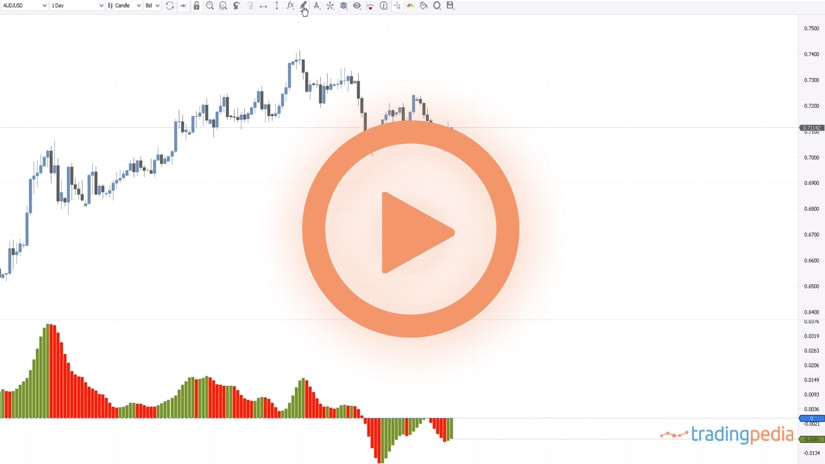
Hello there, this is tradingpedia.com and this video deals with an unusual indicator, in the sense that it is not that popular and definitely not so popular in the currency market. It is based on the stock market, and it is called the McClellan histogram but is more famous as the McClellan oscillator.
Overview
It is based on interpreting the stock market index and you might say what does this have to do with the FX market, but you will see it in a bit. The histogram here shows positive and negative values, and the standard interpretation is that every time it is turning positive it shows bullish conditions, and every time it is turning negative it shows bearish conditions.
But the purpose of this video is to illustrate how to use divergences with the McClellan histogram and how a divergence looks like with this histogram.
Divergence
At this point in time it is important to define what a divergence is – the market forms two highs, but the oscillator does not confirm the second high (bearish divergence). Because the oscillator considers multiple periods when compared to the price, we should base our trust on the oscillator and not on what the price shows.
When you use a histogram, the idea is not to focus on bearish divergences based on the height of these bars. For instance, one might say that this is a bearish divergence because the histogram declines while the price advances. Right? Wrong!
In order for this to be a valid bearish divergence, we need bars on the histogram to turn negative. Or, in a bullish divergence, to turn positive.
An Example
More precisely, we see that the price in the EURJPY declined from the start of 2020 from 122 to 114. We do not interpret divergences like this one – the market formed two lower lows and the histogram is not confirming the second lower low. This is not a divergence – it will be valid if the histogram, in the meantime, turned positive, and only then failing to confirm the new lower low.
How about here? We see that the EURJPY forms two lower lows and then the oscillator forms a bullish divergence. How come? In the meantime, the histogram turned positive and the new move lower was not strong enough for a new lower low, and it formed a divergence with the price. That is a bullish divergence and a nice place to go on the long side.
The same thing happened next. The market makes a new lower low, the histogram shows a bullish divergence as well because we have this cross into positive territory. By the time that we have a new candlestick here, this is as good a place to go on the long side. Even with this new low, it also formed the third bullish divergence Therefore, the market was screaming that it was about to move higher, and it did so.
Now, let’s focus on this move on the right side. How do we define a divergence? We define it as having positive bars, the histogram turns negative, and when the market makes new higher highs, the histogram fails to confirm the second higher high. This is called a bearish divergence and by the time the histogram turns negative, the McClellan histogram gives us almost the top on the EURJPY cross.
Related Videos
Conclusion
Various McClellan oscillators exist. While these are not the ideal oscillators to use in currency trading, the histogram does work with the condition that the histogram moves into positive territory during a bullish divergence, or into negative territory during a bearish divergence.
Thank you for being here – bye, bye.
