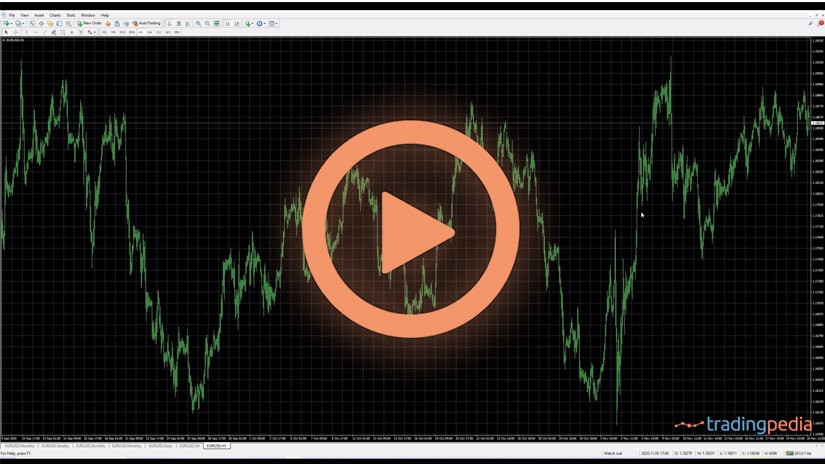
Hello, this is Trading Pedia! As we kick off the New Year, let’s go out and take a look at some of the longer-term trends for the biggest foreign exchange (FX) market traded out there, EUR/USD. We’re going to take a peek inside the patterns and the trends for the EUR/USD exchange rate.
Overview
Now, we will be covering several tools within this video. So if you are unfamiliar with some of the tools like support and resistance or trend lines, moving averages, Fibonacci, RSI, price channels and so forth, make sure you check out the other articles that TradingPedia has on these topics.
The 50-Week Moving Average
So we are going to mix all these together to see what we can get from a longer-term perspective on EUR/USD. We are taking a look at a weekly chart for EUR/USD. On the chart, I’ve got a 50-week moving average (the blue line).
The 50 weeks represents about a year’s worth of time. And so for the most part, this moving average has been moving lower. Recently, it has started to creep higher. The price right now is well above this moving average.
So in my opinion, moving averages are not the most useful, except for when the price gets close to the moving average and right now the price is really far away. So the fact that we are well above the moving average and the moving average is pointed higher doesn’t really offer us a lot of information until we get close to where the moving average currently sits. That’s around the 115-116 area.
But you can see in times past, there were situations where the price came up and came close to that moving average. It acted like support and resistance. So until we reach that point, this 50-week moving average is not going to help us a whole lot.
One thing I do have my eye on that I think is going to be really important over the course of 2021 is going to be this trend line. If we go back to the high in 2008 and draw this trend line, it has been encompassing prices going all the way back to 2008. So that’s 12 to 13 years worth of price action.
EUR/USD has been trading below this trend line. The mood of the market has shifted from being a downtrend to being an uptrend for your USD. We know from Support and Resistance 101 that as markets break out above resistance, then it may come back and act as support in the future.
And so we’ve broken above. We’ve danced along this trend line a little bit. So the price may be peeling away to the upside and wanting to continue that break higher. If we do get a retracement, I would look for this blue trend line to act like support in the future and possibly contain prices.
Fractal
Something else that looks rather interesting here within the EUR/USD chart is a fractal. A fractal is that you will find patterns on the chart at different degrees, at different places. For example, here is a little pattern where you get a kind of an up, down, up. And then, boom! You got a little pattern that does a zigzag like that.
We’ve got a smaller pattern like this. It is a little more exaggerated because it happened around the pandemic, but as you can see, we kind of have two upswings and two downswings, followed by a larger upswing. So we’ve got a fractal of this pattern that has occurred previously.
On the first pattern, after it appeared, we had a large correction taking place. So are we going to see a large correction or not? Well, like I said, I am going to keep an eye on this blue trend line. This blue trend line, if prices do make it down to this level, it could be quite a battle being staged there. That may hold prices up and keep them elevated before moving higher.
One other point, too. If we go back to this fractal pattern and you take a look here at the relative strength index, you will notice that as the price, going into January and February of 2018, as the price pushed up into this high, the relative strength oscillator did not push to a new high. This is called RSI divergence.
That’s like a car driving down the road and it runs out of gas. It still has momentum. It can still move forward, but there isn’t that propulsion behind it to help motor it ahead. And so if you run out of gas while you are going up a hill, then it could quickly reverse on you. It does not mean it’s going to reverse right away. It just means that there is likely some type of a consolidation period coming ahead.
Well, we’ve got another instance of RSI divergence taking place off of these two most recent highs here as well. So we’ve got some warning signs out there that EUR/USD may stage a little bit of a correction. How deep might that correction go?
Well, again, we may come down into this area, which is where the trend line is. Also, you’ve got a horizontal level of support coming across from that previous swing low back in September and October of 2020.
Fibonacci Retracement Levels
Another tool that we could add to this chart is we can come out, we can add some Fibonacci retracement levels. So if we basically go from this low all the way up to this high, assuming that this high is near it and close to it, a couple of levels that I would keep an eye out for are going to be the 0.382 level (that’s near just below 1.17) and the 0.618 coming in near 1.13.
So in the event of a correction low, these are a couple of spots that I would keep an eye on for potential buy zones. Now, how high might this go? This may bounce if we do sell off into that area, it may bounce higher and work itself back up towards that 1.29 to 1.30 mark. So there will be plenty of tradable opportunities taking place in this over the course of 2021.
Related Videos
Conclusion
I hope you like the video. Make sure you check out these other resources on some of the tools that I use in this video. I want to wish you the best of luck in your trading, and we will talk to you soon. Take care. Bye now.


